BrandTrend® DM
Trend Information Delivery and Analysis System
Finally, easy to use, interactive, full featured tables, charts, and trend charts from all of your survey data can be at your fingertips. Now BrandTrend® can attach to any Dimensions dataset to provide the most advanced trend charting software system available. This combination provides both unbeatable speed and ease of use.
Please contact us to set up a web demo and discussion of your needs.
![]()
![]()
![]()
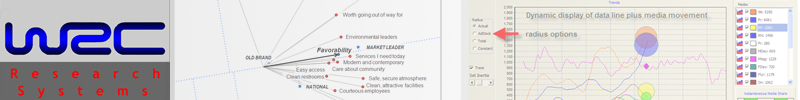
Analysis
- Trend lines can be percents, means, volumes, or share of volume
- Trend lines can easily be multiple variables/responses for 1 brand, multiple brands for 1 variable/response, or multiple filters for 1 brand/variable/response.
- Even more complicated charts are easily produced
- Clicking on trend line shows date and point value
- Can display up to 2 area charts of media data by execution
- Can add sales or volume data to main chart
- Can add events by type to the main chart—Can drag and place event labels on chart
- Can add vertical lines for any specific dates
- Right clicking on a trend line regresses a straight trend line on top of it
- Calculates slope and confidence that slope differs from zero
- Can do a test of proportions for comparing any 2 time periods for all lines in the trend chart
- One button transform of line trend chart into area chart (and back)—useful for display of segments
- Automatic axis scaling—Can be easily overridden
- Can Zoom and Scroll trend charts
- ‘Chart Editor’ provided to allow the user to override titles, axis settings, line colors, markers, gridlines etc.