BrandTrend XL
Advanced Trend Analysis from within Excel!
Now, more than ever, you need to know the impact of your individual media and marketing efforts. Introducing BrandTrend XL -- a breakthrough in media and marketing analysis. And the easiest way to produce trend charts! All you need is Excel, your trend data, and BrandTrend XL.
Please contact us to set up a web demo and discussion of your needs.
Play Demo: BrandTrend XL Analysis Video (screen > 1024 x 768)
Play Demo: BrandTrend XL Analysis Video (screen > 800 x 600)
White Paper: Analyzing Advertising and Marketing Effects with BrandTrend XL
(A useful reference when viewing the video!
![]()
![]()
![]()
Additional Features
- Media Display
Colors/patterns automatically set for each execution
Colors (optionally) can be easily preset in the media data file - Template
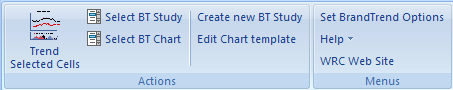
Edit, save and use BrandTrend template
Change all aspects of the main and media chart displays
Toggle template on or off
Select from pre-defined color themes or devise your own - Printing
Excellent, high resolution, consistent printing to all color printers
Optional addition of markers and deletion of gradients especially for printing to black and white printers
Easy setting of print options - Presentation
features/Clipboard interface
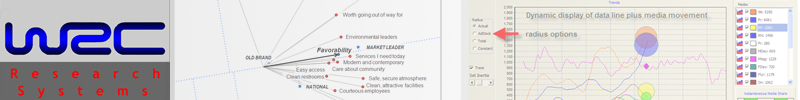
Multi-media: Video, audio, pictures and text of or related to media spending can be played or shown by clicking on the execution in the media display.
High resolution output to clipboard for pasting into publishing programs, etc. - Saving
All chart features and data are saved in a compressed format
‘unlimited’ naming capability for saved charts - Recall
All saved charts can easily be brought up for analysis in an active basis
Saved charts can be brought up, changed, and re-saved or saved as a new chart - Miscellaneous
Many charts can be open on the screen at once
Rapid re-rolling of data on any time period
Automatically handles gaps in data collection
Works with all world wide date formats
Optional date display: DD/MM/YY, MM/DD/YY, DD MMM YY
Can easily hide or unhide lines on the chart
Trend line labels produced automatically—can be modified
Trend lines colors assigned automatically—(optionally) can define study defaults—(optionally) can be redefined after the chart is produced
Automatic handling of trend line start dates
Automatic handling of trend line end dates
Line labels linked to end of line—with no overlap
Annotation capability
Secure chart sharing/editing capabilities between users on a network
‘Chart Editor’ provided to override titles, axis settings, line colors, markers, gridlines etc.