|
Product Summary
BrandMap® is the choice of professional researchers
worldwide for user friendly, rapid analysis and production
of presentation ready biplots, correspondence, and mdpref
maps directly from highlighted Excel tables. The exclusive Brand
Projector™
calculates and graphically displays the attribute changes
necessary for brand re-positioning to any point on a map.
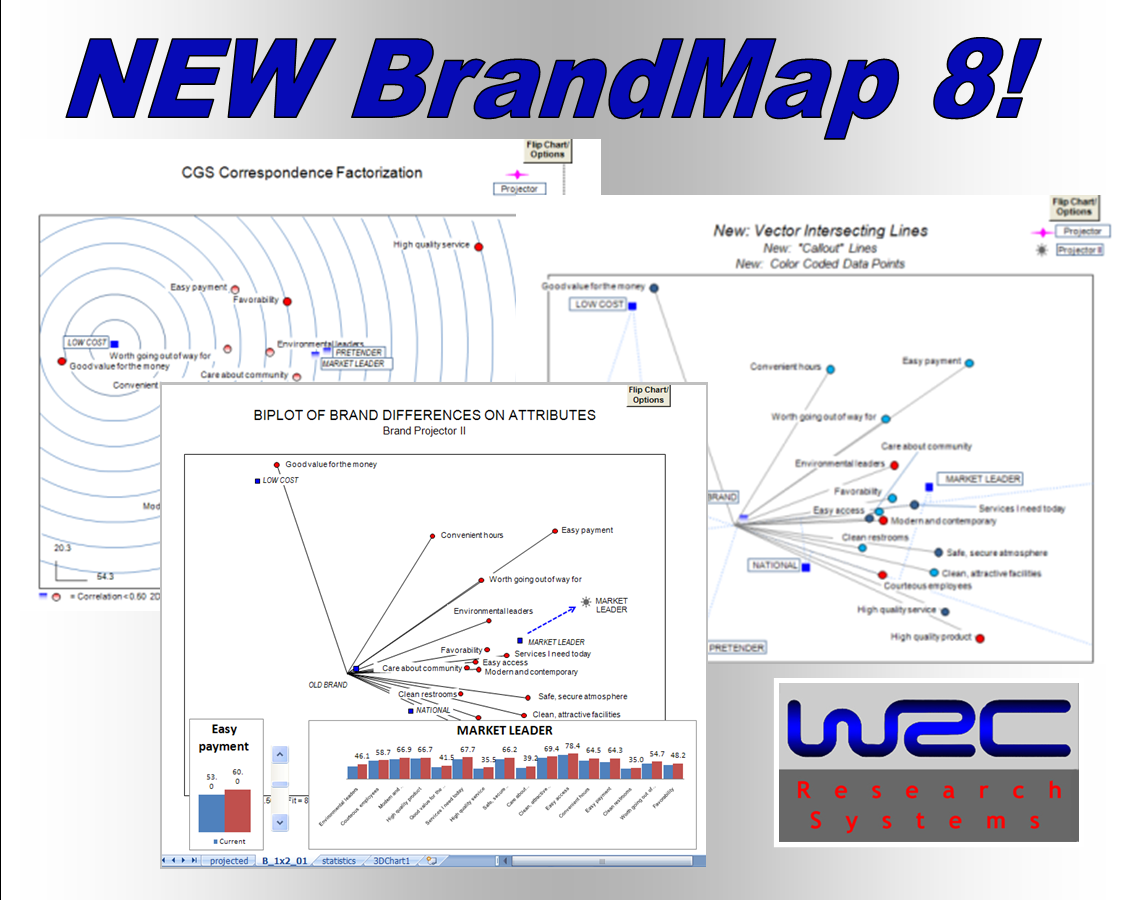
The new Version 7.0 features true 3D rotatable maps and
Brand Projector II™,
which allows a researcher to drag an attribute higher or
lower while watching the brand move on the map. BrandMap®
operates with Excel and is fully MSOffice compatible.
Key Features
New BrandMap 8 Ribbon
Interface
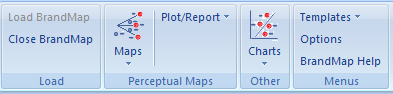
New Features
-
Excel 2003/2007/2010 compatible
-
New ribbon (Excel 2007/2010) or toolbar
(Excel 2003) interface
-
Selectable, automatically drawn perpendicular
intersecting lines for vector maps.
-
Select a label to instantly create a temporary or
permanent line between the label and its data point.
-
Multiple Correspondence Analysis computations and maps
-
Ability to easily color code data points.
-
Concentric distance circles available for CGS or MCA
maps.
-
Ease of use features for plotting large numbers of data
points.
-
Improved overall operation.
All Features
- Presentation
quality, report ready, customizable maps in
seconds
- Point and click
operation, fast computation and plotting, handles
large matrices
- Fast high
quality output to laser and color printers
- Easy copy
and paste into your word processing documents (see
examples!)
- Easy data entry—the
data matrices (tables) can be entered by hand into the
spreadsheet, imported from Quantum or other tab
packages, pasted in from other applications
- Brand and
attribute labels are automatically applied and located
No need to re-enter them
- Labels can be
individually or globally edited, bolded,
underlined, italicized, boxed, etc. Fonts,
sizes and
colors
can be easily changed
- Clicking on a
data point provides a visual link to the appropriate
label to aid in re-positioning labels
- Easy hiding and
un-hiding of data points, labels, and vector lines
- Clicking on a
data point in analysis mode on a vector
chart instantly charts the brand intersections
on that attribute vector.
The intercept charts produced in analysis mode for biplots
are now calibrated to the original attribute scores
- Maps can be easily
flipped or rotated with just a click
- Supporting
statistics are reported—coordinates, variance,
correlations, inertias, ranks
- All ‘data
centering’ and factorization options are
provided
- Supplemental
rows/columns (passive data points) are provided for
correspondence maps, biplots, and mdpref maps
- Any axes can be
plotted, with subsequent axes scaled in proportion
to the first two
- Vector lines can
be optionally plotted to the attribute data points
- Extra text,
circles, arrows, and other annotations can be easily
added to any map
- Extensive
context sensitive on-line help is always available
- Can directly
map coordinates and labels produced by other statistical
procedures
- Quadrant chart produces an automatically labeled scatterplot of
any 2 columns of numbers. Labels are placed to
not overlap data points or other labels
- Bubble chart produces an automatically labeled scatterplot of
any 3 columns of numbers. Labels are placed to not
overlap data points or other labels
-
Regression chart
with optional logit transform
can indicate brands performing above or below expectations
-
Radar
chart
has option to indicate relative as well as absolute
brand performance
-
The exclusive
Brand Projector I
allows you to move a brand to any point on the map and
calculates the attribute changes necessary to get to that point
-
The exclusive
Brand Projector II
allows you to drag an
attribute higher or lower while watching the brand move on the map
-
3D Plot: View the 1st 3
dimensions of your map at once with this rotatable labeled
display
-
Easily hide and unhide data points, vectors, and
labels
-
Extensive use of templates to set label and data
point formats
-
Easy Internet download and registration
-
Easy license transfer
-
Complete on-line help
-
Complete PDF manual
-
Single machine and network versions available
BrandMap provides major gains in productivity compared to
non-integrated approaches to producing perceptual maps and
quadrant charts. Working within Excel, BrandMap provides
for easy data access or entry, fast calculation and
presentation of statistics, and rapid graphical production
of maps and charts. Just highlight your data table
(complete with labels) and BrandMap calculates the
relevant statistics and produces fully automatically
labeled, presentation ready perceptual maps. There is
extensive flexibility provided both in terms of
statistical options as well as in the graphical
presentation.
BrandMap
provides completely presentation ready output and
extensive flexibility in terms of fonts, annotations,
flips, and rotations. Excellent quality output is provided
to laser and color printers. Also provided is an easy to
use procedure for copying your BrandMap into presentation
packages such as PowerPoint. Data point labels are
automatically placed so as to not overlap and can be
easily placed manually as well. Also, clicking on a data
point highlights its label! Extra text, arrows, boxes,
circles, etc. can be easily added.
The
rapid, interactive nature of BrandMap makes it possible to
take several different looks at your data in a very short
time. You can easily try different mapping techniques or
options and visually compare the maps of your data.
Clicking on a data point in analysis mode on a vector
chart instantly charts the brand intersections on that
attribute vector.
The exclusive Brand Projector™ calculates and graphically
displays the attribute changes necessary for brand
re-positioning to any point on a map. The Brand Projector™
object is just moved via mouse to a point on the map.
Clicking on the object allows you to select the brand
(column point) you would like to move there, and then a
chart of attribute changes is immediately generated.
The new Version 7.0 features true 3D rotatable maps and
Brand Projector II™, which allows a
researcher to drag an attribute higher or lower while
watching the brand move on the map.
Supplementary (or
passive) rows and columns can be plotted on correspondence
maps, biplots, and mdpref maps.
BrandMap has been used in
many areas of research to include: perception
research, pharmaceutical product development, sensory
research and product development, food product
development, financial and banking product and
institutional research. Additional areas of
research use include political, automotive, FMCG,
durables, advertising, brand equity, and many others.
BrandMap is also used
for teaching by many universities and colleges around
the world. Please
contact us for our
special pricing for an unlimited network license for
academic institutions.
- Software
Requirements
- Note! Version
8.0
requires Excel 2003 or later, Windows 98, NT,
2000, XP, Vista or Windows 7.
- Hardware
Requirements
- Pentium or compatible.
- Capacities
- BrandMap
capacities are substantial, but not unlimited. The
maximum number of columns varies by version of Excel:
- BrandMap can handle the majority of tabled data
that anyone might reasonably want to map.
-
Correspondence Analysis
- Supports
supplemental (passive) rows and columns, 4 different
factorizations, Brand
Projector™. Statistics:
produces inertias, coordinates, variance, chi-square,
cell inertias, and correlations.
-
Biplots
- Supports
supplemental (passive) rows and columns, 3 different
factorizations, all data centering and standardizing
options, Brand Projector
1™ and Brand Projector II™.
Statistics: produces coordinates, variance, and
correlations.
- Mdpref
- Supports
supplemental (passive) rows and columns,
Brand Projector™.
Statistics: produces coordinates, variance, and
correlations.
- Multiple
Correspondence Analysis
- Supports supplemental
(passive) rows and columns, 3 different factorizations.
Statistics: produces coordinates, variance, inertias, and
correlations.
- Brand Projector
I™
- Calculates and
graphically displays the attribute changes necessary for
brand re-positioning to any point on a map.
- Brand Projector
II™
- Allows a researcher to
drag an attribute higher or lower while watching the
brand move on the map.
- Quadrant/Bubble
Charts
- Automatically
applies non-interfering row labels to data points
displayed in an Excel scatterplot or bubble chart. An
updating feature allows for easy generation of a series
of identically formatted charts with different data in
each.
- Vector Overlay
- Applies
attribute vectors from a correlation matrix (brand x
attribute) to brand data points from MDS or discriminant
procedures.
|